Applies To: ThreatSync
Some of the features described in this topic are only available to participants in the ThreatSync Beta program. If a feature described in this topic is not available in your version of WatchGuard Cloud, it is a beta-only feature.
The threat activity graph for an Indicator of Attack (IOA) incident is an interactive diagram of the sequence of events that led to the generation of the IOA. The graph illustrates events with nodes and arrows to show the relationship between them. You can use the graph to help identify the root cause of an attack.
If an IOA incident has a graph associated with it, on the Incident Details page select the Threat Activity Graph tab to open the graph.
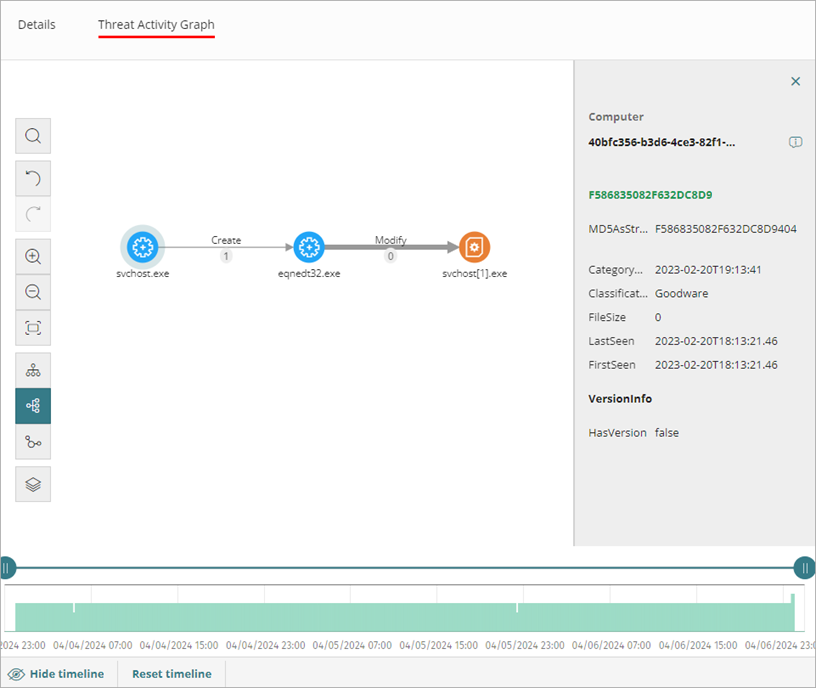
By default, the graph displays activity horizontally with the node that triggered the IOA at the center of the graph. It is surrounded by a subset of nodes related to the IOA. The graph displays three node levels above the main node, as well as one node level below the main node.
Nodes represent entities that participate in an operation (such as processes, files, or communication or operation targets). Arrows represent operations. To change the information shown on the graph, use the toolbar options and select specific nodes. You can use the timeline below the graph to change the time period that the graph displays events for.
The information pane on the right shows event information for the selected node or arrow.
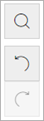
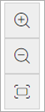
Toolbar
The toolbar enables you to change the appearance of the graph. These buttons are available in the toolbar:
| Button | Name | Description |
|---|---|---|
|
|
Search | Search for and highlight nodes in the graph |
| Undo | Undo the last action performed on the graph | |
| Redo | Redo the last action performed on the graph | |
| Zoom in | Zoom in the graph | |
| Zoom out | Zoom out from the graph | |
| Reset zoom | Return to the default zoom level | |
| Horizontal graph | Change the graph orientation to horizontal | |
| Vertical graph | Change the graph orientation to vertical | |
| Change orientation | Change the graph orientation to maximize space in the window | |
| Show / Hide Layers | Show or hide information layers in the graph |
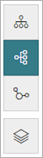
To show or hide layers in a threat activity graph:
- In the toolbar, click
 .
. - From the menu that opens, select the layers you want to show or hide:
- Execution Sequence — Hides or shows numbers on the events that indicate the order in which events occurred.
- Name of Relationships — Hides or shows the names of the events. For more information, go to Indicators of Attack Events.
- Name of Entities — Hides or shows the names of entities (such as processes, files, or communication or operation targets).
Graph Nodes and Arrows
Nodes represent the entities that participate in an operation (processes, files, or communication or operation targets) and arrows represent operations. The numbers on the arrow indicate the order in which the events were recorded.
Select Nodes
When you select a node, the information pane displays details of the events that occurred. For more information, go to Indicators of Attack Events.
- To select a single node on the graph, click the node.
- To select multiple non-contiguous nodes on the graph, press and hold the Ctrl or Shift key and click the nodes you want to select.
- To select multiple contiguous nodes on the graph, press and hold the Ctrl or Shift key, and click an empty area of the graph. Drag the mouse to draw a selection box that covers all the nodes you want to select.
Right-click a node or node group to open the shortcut menu.
When you select several nodes on the graph and right-click, only the options that apply to all the selected nodes show in the shortcut menu.
The color of a node indicates how the item is classified:
- Red — Malware
- Orange — Suspicious or unclassified
- Blue or Green — Goodware
Node and Status Icons
These node icons represent different entities in an operation.
| Icon | Description |
|---|---|
|
|
Process |
|
|
Remote thread |
|
|
Library |
|
|
Protection |
|
|
Folder |
|
|
Non-executable file |
|
|
Compressed file |
|
|
Executable file |
|
|
Script file |
|
|
Windows registry branch value |
|
|
URL used in a communication |
|
|
IP address in a communication |
These status icons indicate the action taken on the node:
| Icon | Action |
|---|---|
|
|
File deleted |
|
|
File disinfected |
|
|
File quarantined |
|
|
Process deleted |
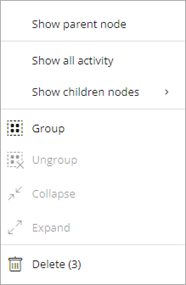
Show Child Nodes
The graph can show up to a maximum of 25 nodes at the same level. When there are more than 25 nodes, the graph shows no nodes. An icon in the bottom left corner of a node indicates that the node has hidden child nodes.
To show child nodes:
- Right-click a node.
The shortcut menu opens. - Select one of these options:
- Show Parent Node — Shows the parent node of the selected node.
- Show All Activity — Shows all child nodes of the node regardless of type. The maximum number of nodes shown is 25. The total number of events that link the parent node with the child node shows.
- Show Children Nodes — Opens a drop-down list. Select the type of child nodes to show and select the number of nodes for each type. The types of nodes include:
- Compressed files
- Data files (files with unidentified information)
- DNS (domains that failed to resolve the IP)
- Downloads
- IPs (IP addresses for either end of the communication)
- Libraries
- PE files (executable files)
- Processes
- Protection (action taken by the antivirus)
- Remote threads
- Script files (files with command sequences)
- Windows registry entries
Move and Delete Nodes
You can move and delete nodes to focus the graph on the information you want to view.
To move a single node, select the node and drag it to a new location.
All lines that connect the node with its neighbors move and adjust to the new location of the node.
To move the graph to view other nodes:
- Click an empty area of the graph.
- Drag the graph in any direction.
To delete a single node:
- Right-click the node you want to delete.
The shortcut menu opens. - Select Delete (x).
A dialog box opens and shows the total number of nodes that will be deleted from the graph. This includes the selected node and its child nodes.
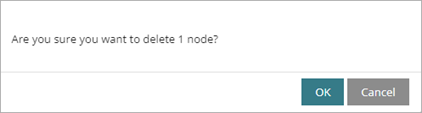
- Click OK.
To delete multiple nodes:
- Press and hold the Ctrl key.
- Click the nodes you want to delete.
- Right-click one of the nodes.
The shortcut menu opens. - Select Delete (x).
A dialog box opens and shows the total number of nodes that will be deleted from the graph. This includes the selected nodes and their child nodes.
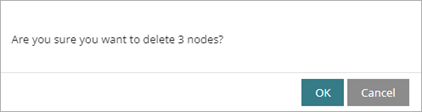
- Click OK.
Arrows
The color of the arrows indicates whether the action was blocked or allowed.
- Red — The action was classified as a threat and blocked.
- Black — The action was allowed.
The thickness of the arrow represents the number of times the same type of action was executed between two nodes. The greater the number of actions, the thicker the arrow.
When you click an arrow, the information panel shows the dates when the first and last actions in the group occurred. The direction of the arrow indicates the direction of the action.
The numbers on the arrows indicate the order in which the events were recorded. When you click the label of an arrow, the information pane displays the events that occurred. For more information, go to Indicators of Attack Events.
Timeline
The timeline is located below the graph. It includes a histogram with bars that represent the events carried out by a threat. Point to the bars to show a tooltip of the number of events and the date they were logged.
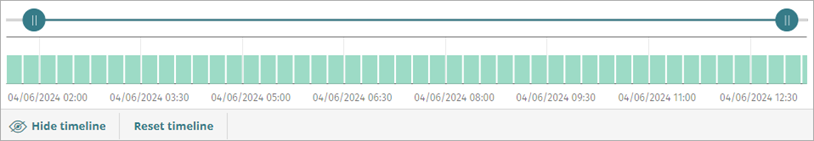
The controls at the bottom of the timeline enable you to position the view at the precise moment when the threat carried out an action and retrieve extended information that can help you complete a forensic analysis.
- To select a specific interval on the timeline, drag the interval selectors to the left or right. The graph shows the events and nodes that occurred within the interval. Other events and nodes are blurred.
- To hide the timeline, click Hide Timeline. To show it again, click Show Timeline.
- To return to the default timeline setting, click Reset Timeline.